
小樽商科大学2019年第5問(a)
小樽商科大学の2019年第5問(a)は、グラフを読み解き、グラフで表されているデータの特徴を英語で記述する方式です。
今回の小樽商科大学の自由英作文のレベルは、下記の通り。
| レベル | 内容 |
|---|---|
| 高校生 | グラフに表し、理解しやすくする |
| 難関私立大 | グラフを読み取り、その内容を表す英文を選択肢から選ぶ |
| 小樽商科大学 | グラフを読み解き、英語で表現させる |
上記の通り、小樽商科大学の自由英作文は、将来のビジネスで使える基礎となる英語力を試す試験です。
「小樽商科大学 自由英作文」2019年 第5問(a)
【問題】
Table (A) shows the enrollment ratio in three different levels of education in developed countries and developing countries. It also shows how it had changed from 1970 to 2001. Using Table (A) for reference, explain differences and similarities of the trend in education between the developed and developing countries.
「小樽商科大学 自由英作文」の考え方
- 英語の問題文を読む
- 単語・文法をチェックする
- 問題文の内容を把握する
- 解答に必要な単語をピックアップする
- ストーリーの展開を考える
- 英作文を作成する
単語・文法
| レベル | 単語・文法 | 訳 |
|---|---|---|
| 上級 | enrollment | 在籍者数 |
| 中級 | ratio | 比率・割合 |
| 中級 | reference | 参照 |
| 上級 | similarities | 類似点 |
答えを導くために必要な単語・文法
| レベル | 単語・文法 | 訳 |
|---|---|---|
| 初級レベル | Table A shows that … | 表Aは~を表している、表Aから~がわかる・読み取れる |
| 中級レベル | enrollment ratio | 入学者の割合 |
| 中級レベル | attendance | 就学(率) |
| 中級レベル | developing countries | 発展途上国 |
| 中級レベル | developed countries | 先進国 |
| 中級レベル | all along | ずっと |
| 初級レベル | rise | 上昇 |
| 初級レベル | far behind | 大きく遅れている、ずっと遅れている、遠く及ばない |
自由英作文の解き方
- 問題文を翻訳(内容を把握)する
- グラフを読み取る
- 必要な単語を問題用紙にメモする
- 自由英作文を作成する
1.問題文を翻訳(内容を把握)する
問題文(英語)
Table (A) shows the enrollment ratio in three different levels of education in developed countries and developing countries. It also shows how it had changed from 1970 to 2001. Using Table (A) for reference, explain differences and similarities of the trend in education between the developed and developing countries.
問題文(翻訳)
「表Aには発展途上国と先進国の教育に関し、大学、中学・高校、小学校の3つの異なる教育レベルの就学率の違いと、1970年から2001年にかけての変化が表されている。表(A)を用い、発展途上国と先進国における教育の傾向の相違点と類似点60語前後で説明せよ」
2.グラフを読み取る
表Aから次のことを読み取っていく。
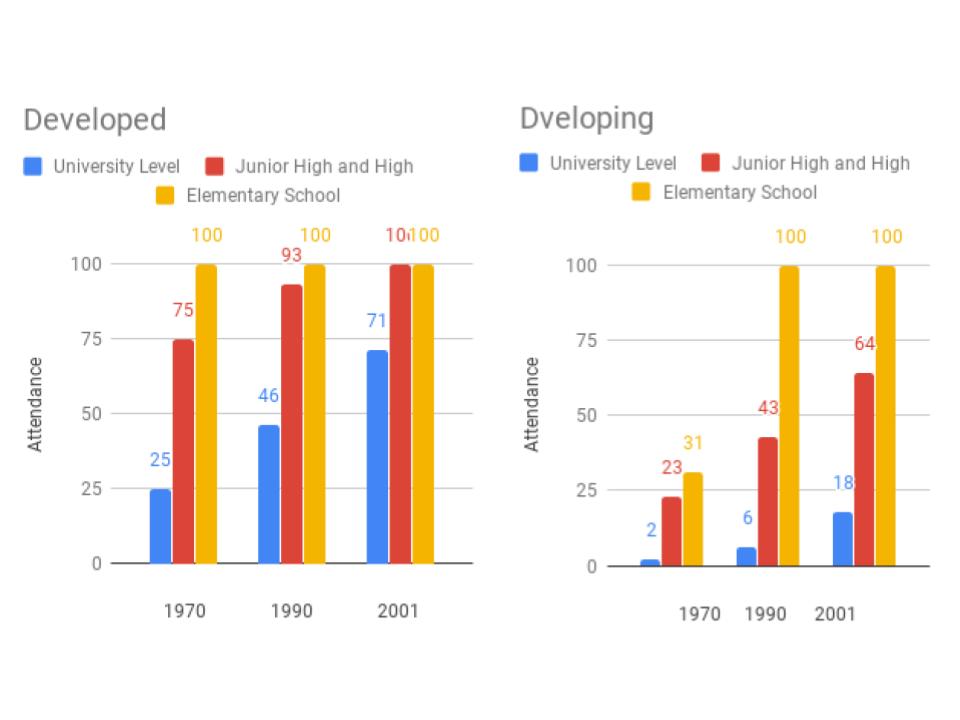
大学レベルの就学率 the enrollment ratio in university level
先進国 1970年 25%、1990年 46%、2001年 71%
発展途上国 1970年 2%、1990年 6%、2001年 18%
中学・高校レベルの就学率 the enrollment ratio in junior high and high school level
先進国 1970年 75%、1990年 93%、2001年 100%
発展途上国 1970年 23%、1990年 43%、2001年 64%
小学校レベルの就学率 the enrollment ratio in elementary school level
先進国 1970年 100%、1990年 100%、2001年 100%
発展途上国 1970年 31%、1990年 100%、2001年 100%
先進国、発展途上国ともに大学レベル、中・高校レベルとも就学率は上昇している。
小学校レベルについては、発展途上国は1970年は就学率は低いが1990年から2001年は100%になっている。先進国は調査期間を通して100%である。
大きな違いは大学レベルの就学率で、発展途上国は先進国に対し差が大きい。2001年においても大きく離されている。
3.必要な単語をメモする
就学 school attendance
低い low
維持する、~のままである maintain
上昇 rise
大きく離されている far behind
割合 rate
4.自由英作文を作成する
ポイント!
developed と developing の意味の違い
developed countries 「発展した国」→「先進国」
developing countries 「発展しつつある国」→「発展途上国」
differencesとsimilaritiesは、知っていて当たり前の単語ですが、注意をしておきましょう。
自由英作文の模範解答
表から読み取ったことを英語で記述していく。
模範解答(必要なレベル)
Table A shows that elementary school attendance in developing countries was low in 1970, but from 1990, it has been 100%. All along, developed countries maintained 100 % attendance at the elementary school level. Both developed and developing countries show a rise in junior high and high school attendance, as well as university attendance. Developing countries are far behind in university attendance whose rate was still low in 2001. (68words)
模範解答(最低限必要とされるレベル)(高校初級レベル)
Elementary school attendance in developing countries was low in 1970 but it was 100% in 1990 and 2001. Attendance at the elementary school in developed countries was 100% from 1990 to 2001. Table A shows a rise of attendance in junior high and high school, as well as in university, both in developed and developing countries. Much more students go to university in developed countries than in developing countries. (68語)